
Plasma Waste Converter
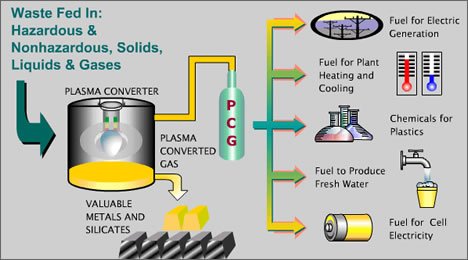
Municipal solid waste is considered a renewable resource, because its production in our society is continuous. Plasma Waste Conversion (PWC) is a unique technology utilizing this waste stream with a broad range of positive impacts to our economy and environment.
- Eliminates the need for land fills, freeing up additional space for other purposes.
- Provides a means to potentially mine old land fills, which eliminates the leaching and other contamination issues associated with land fills; including the resultant methane production which is a significant green house contributor.
- PWC is the ultimate in recycling since all organics are turned into energy and all metals and in-organics are fed back into the economy without the need for sorting or separate handling.
- PWC provides distributed generation capacity. As a result, restructuring the National Power Grid to distribute the power would not be a part of the cost equation.
- If utilized nationally PWC would provide about 70 Gigawatts of distributed generation.
- This distributed power will fuel economic growth, help maintain cheap electricity, and reduce demand on natural gas.
- Provides a significant decrease in Green House gases.
For a more detailed explanation of a plasma waste converter, go to: http://www.howstuffworks.com/plasma.htm
KVA has made significant improvements in increasing the efficiency in generation of electricity and recovery of waste heat and continues research to advance those improvements even further. For more details on this subject refer to Waste Heat to Electricity on this web site.
Capital and Installation Costs
The following table is provided for reference and comparison purposes. The table displays the cost in dollars per kilowatt of capacity. These numbers include the initial capital and installation costs to purchase and install an energy technology at a specified location. Capital costs refer to the total equipment cost of a power generation system (i.e., fuel cell system, combustion turbine, etc.) to the end user. This table also gives some comparison of the indirect costs associated with the technology. The last column is used to relate the cost of money and the relative return on investment. The lower the percentage the better. For instance solar is 69%, which when translated means that if all operating conditions of solar usage are optimal (365 days of sunlight), the savings provided from the generated electricity would just cover the interest expense.
| Capital Cost ($/kW) | Indirect Costs | Breakeven Usage* | |
|---|---|---|---|
| Nuclear | 2500-4000 | 1100-2500 (disposal) | 21% |
| Micorturbine | 700-1100 | 0 | 6% |
| Combustion Turbine | 300-1000 | 0 | 5% |
| IC Engine | 300-800 | 0 | 3% |
| Plasma Waste Conversion | 3000-5000 | 0 | 27% |
| Waste Heat to Electricity | 500-1800 | 0-1000 | 8% |
| Fuel Cell | 3,500-10,000 | 0 | 34% |
| Photovoltaic | 4,000-6,000 | 700-2100 | 69% |
| Wind Turbine | 800-3,500 | 300-1100 | 14% |
| *This represents the percentage of utilization required to simply offset the cost of money to install the system at 6% interest with a return based on $0.10 per kilowatt hour avoided electrical cost. | |||